We’ll also discuss the importance of Bitcoin mining and what has changed since 2009 to 2020 in the mining space.
BTC Price and How it’s Determined
The BTC price has been the discussion of everyone’s mind throughout the years. It has seen the most appreciation out of any traditional financial asset. Out of the 100,000,000 bitcoin owners, almost 100,000 wallets have over $1million dollars worth. This means, statistically speaking, you have a 1 in 1000 chance of being a bitcoin millionaire.
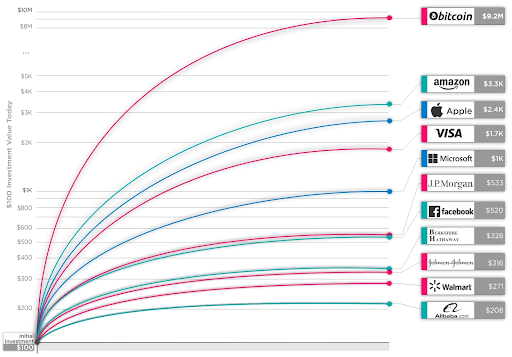
As you can see, if you had invested $100 when bitcoin started, your investment would be worth $9 million dollars today. All the other assets such as Amazon don’t even compare at all.
Now you might be thinking, “how did the price go up so much?” Well, there are many reasons and phases of Bitcoin you need to understand. With every level of magnitude ($10 – $100, $100 – $1000, etc) bitcoin goes up in price, there is an ever changing narrative of what Bitcoin is and the use cases of bitcoin.
In the beginning, Bitcoin was about seeing if we could create a decentralized system of payment, without having to go through 3rd parties like banks or payment processors. Now the narrative is about bitcoin being the ‘digital gold’ and an immutable store of value. The shift in narrative has introduced traditional finance to look into what Bitcoin is and as a consequence, billions of dollars have flown into bitcoin.
The other more technical factor of how the price of BTC is determined has to do with Bitcoin’s four year cycles. Every four years, Bitcoin goes through a halving – what this means is that the maximum BTC miners can mine every day is reduced by half.
It started off at 50 BTC reward per block and it halved to 25 BTC in 2012, 12.5 in 2016 and in 2020 the reward was 6.25 per block.
And with simple economics, when the supply decreases but the demand increases, the price must go up to meet the equilibrium.
But someone might say what causes the demand for bitcoin?
And that’s a great question. There are many use cases for which someone would want to use bitcoin.
- Decentralization
- Protection Against Forceful Governmental Wealth Seizure
- Inflation Hedge
In 2020 globally, many countries have printed more money than they ever have this year to combat the coronavirus. As a consequence, inflation rates are forecasted to rise heavily in the years to come.
An investor looking to protect themselves against inflation doesn’t have too many options. Gold and Property are the usual assets but even those are risky. That’s why many fund managers have been placing their bets on bitcoin.
There’s also an increasing problem of governmental power in countries such as Venezuela or Argentina and other 3rd world countries. Their currency is hyperinflating at such a rate where they lose 50% every year. Governments can also seize assets if they want to as well.
To those people, decentralization is a must so their corrupt governments cannot take their assets as they wish. The idea of being able to be your own bank is becoming more and more important to countries outside the developed nations.
And such, those are the major economic factors currently in play to drive the price and adoption of Bitcoin.
Bitcoin Price Events In 2015
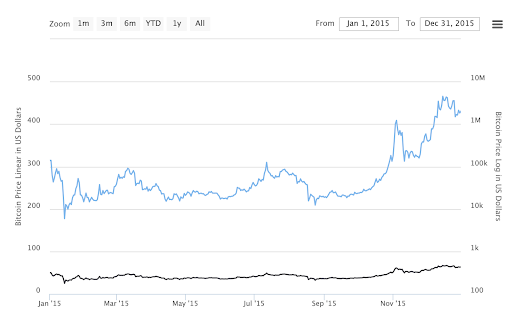
In 2015, the price at the start of the year was $318 and by the end of 2015, it was $425 – a 133% increase.
The All Time Low of the year was: $172
The All Time High of the year was: $463
This was the year Ethereum launched as well.
Bitcoin Price Events In 2016
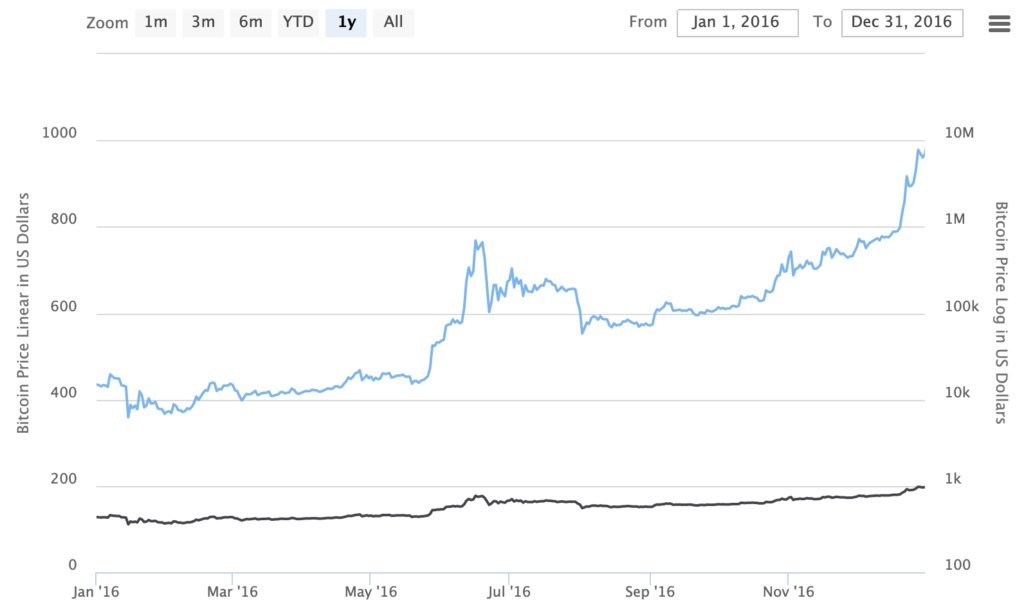
In 2016, the price at the start of the year was $432 and by the end of 2016, it was $952- a 220% increase.
The All Time Low of the year was: $375
The All Time High of the year was: $960
In 2016, the halving event occurred in May and made the reward per block to 12.5 bitcoin.
2016 was when BTC broke the ATH from 2015 and subsequently kicked off a new bull market.
Bitcoin Price Events In 2017
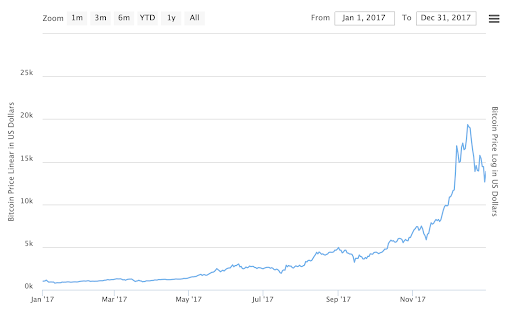
In 2017, the price at the start of the year was $956 and by the end of 2017, it was $12,800- a 1338% increase.
The All Time Low of the year was: $956
The All Time High of the year was: $19,665
2017 was the year BTC went crazy and this was the first time where there was mainstream media coverage and hype surrounding the cryptocurrency. Because of the huge influx of new people entering the system, the bitcoin transactions were sky high and the fees were extraordinary.
This prompted a heavy debate within the bitcoin developers on how to solve this problem. There were two schools of thought. The first group of developers wanted to implement ‘segwit’ into bitcoin. The second group wanted to increase the block size of bitcoin so that each block can accommodate more transactions.
Not everyone agreed so bitcoin forked into Bitcoin Cash (BCH).
In terms of the price, there is some speculation that Tether was manipulating the price by printing more Tether out of thin air as they have not proved each Tether was backed by 1 USD.
Bitcoin Price Events In 2018
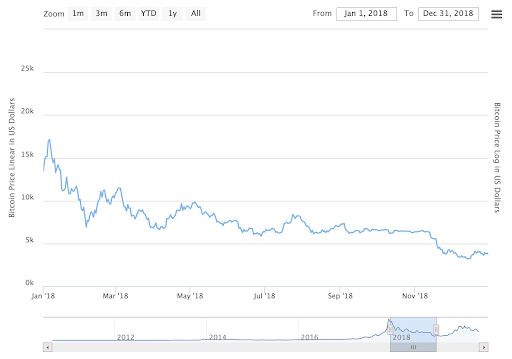
In 2018, the price at the start of the year was $13,760 and by the end of 2018, it was $3,846 – a 72% decrease.
The All Time Low of the year was: $3,846
The All Time High of the year was: $18,343
Following the crazy rally in 2017, 2018 was a devastating year for crypto as the price of bitcoin went down 72%. It was somewhat a slow descent as it took a whole year to get down to $3k. But it was a rapid drop from $20k to $10k.
Bitcoin Price Events In 2019
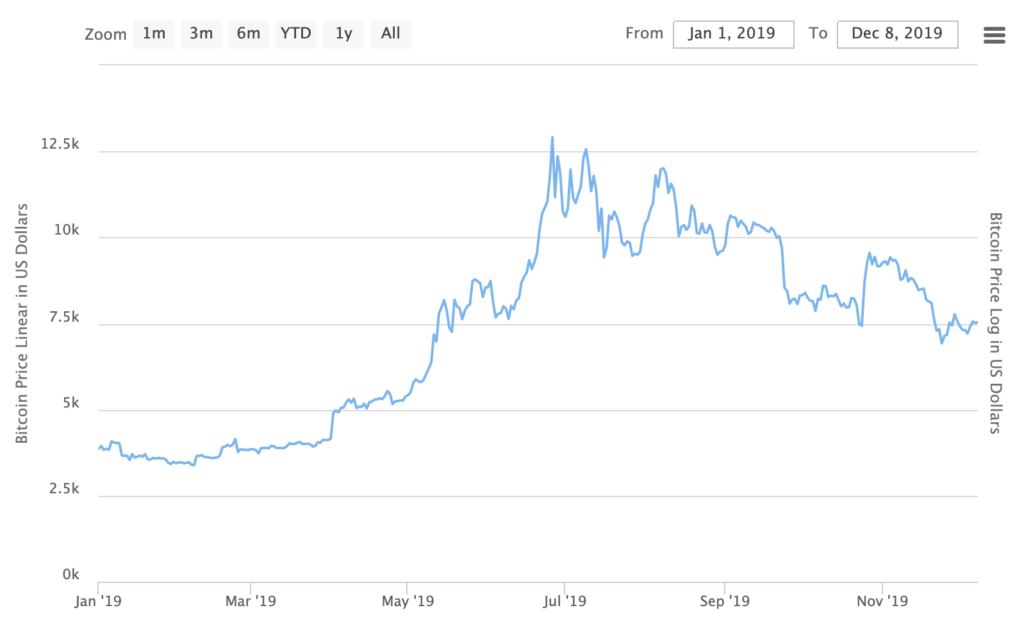
In 2019, the price at the start of the year was $3,747 and by the end of 2019, it was $7,276 – a 194% increase.
The All Time Low of the year was: $3,692
The All Time High of the year was: $12,996
This year had given false hope to many people as the price of bitcoin rose sharply from $3k to $12.5k. But bitcoin was not able to sustain the price and so it fell back down to around $7k.
Bitcoin Price Events In 2020
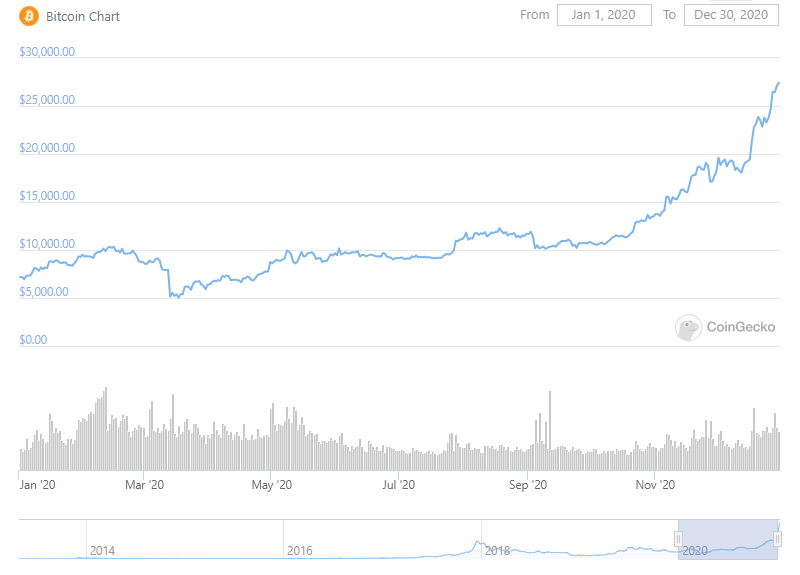
In 2020, the price at the start of the year was $7,202 and by the end of 2020, it was $29,093 – a 403% increase.
The All Time Low of the year was: $5,032
The All Time High of the year was: $29,093
What a crazy year in 2020 for bitcoin. When the pandemic hit, bitcoin like many other assets dropped like a rock down to $5k. But was the world macro-economic situation played out and more money has been printed than ever before… people began to see bitcoin as a safe haven or store of value to hedge against inflation.
This caused the start of an insane rally of breaking the previous ATH at $20k and finishing the year off at $29k.
The Biggest BTC Trading Days In History
Regardless of whether the bitcoin price rose or fell, the volume is a measure of the dollar amount of transaction which took place for bitcoin. And these are the biggest trading days in BTC history.
The highest trading day was on Dec 8, 2017 when the total volume of all exchanges of bitcoin hit $5 billion dollars.
The next largest day was Feb 6, 2017 when the total volume hit $3.9 billion dollars.
The third largest day was Nov 29, 2017 when the total volume hit $3.9 billion dollars.
The fourth largest day was Dec 20, 2017 when the total volume hit $3.5 billion dollars.
The fifth largest day was Jan 16, 2018 when the total volume hit $3.4 billion dollars.
Bitcoin in Canada
In Canada, while you can use bitcoin to make purchases, bitcoin is not treated as legal tender. But that does not make bitcoin illegal as the Canadian government is running experiments themselves with blockchain technology to potentially issue their own central banks digital currency.
Money businesses of MSB’s who deal with bitcoin will need to be regulated and register with the Financial Transactions and Reports Analysis Center of Canada (FINTRAC) so that the business is in compliance with Canada’s Anti-money Laundering, AML plans.
As for tax, it is a little uncertain how the Canadian Governments treat crypto. But in general the way the government wants to tax crypto is similar to other assets such as gold or property. When you acquire bitcoin, that in itself is a non-taxable event but you must record your ‘cost’ you bought in.
Then when you sell your cryptocurrency, either for another crypto or back into CAD, the taxable gain is the difference between your selling price and your cost price.
When businesses accept cryptocurrency as payment, it falls under the ‘Barter Transaction’ law in Canada. What this means is the business will not be taxed at the time of the exchange, but also when they exchange it for either CAD or other products and services.
Bitcoin Mining In Canada
We would not recommend mining bitcoin in Canada. The average electricity consumption rate in Canada is around 17c per kWh with Quebec being the cheapest at 7c kWh.
Not only do you need to consider your electricity costs, but you also need good hardware to mine bitcoin… and these days in 2021, GPUs don’t cut it anymore. Your competition is huge data warehouses with cheap electricity costs and ASIC cards. These stand for Application-Specific Integration Circuit. And they are specifically designed to solve algorithms faster than any consumption grade GPU’s.
It is also hard to get your hands on one as the supply is limited to some people – and if you do happen to get an opportunity to buy one, it’ll cost upwards of $3000+ just for one.
This is why more and more bitcoin miners drop out of the game as it gets increasingly difficult hash rate and expensive to keep up with the profitability.
The Evolution of Bitcoin Mining
Mining has come a long way since Satoshi Nakamoto’s days. Bitcoin miners started off with using regular CPUs to solve the bitcoin algorithm to gain the block rewards. But as more and more people joined the mining train, the difficulty increased… so miners moved on to GPUs to mine bitcoin.
And in 2017, this is so popular that there were shortages on the GPU market with Nvidia and AMD cards – and this led to sharp price hikes on these components. Of course it will still be profitable for miners to buy expensive GPUs and the bitcoin market skyrocketed in 2017 due to the bitcoin halving in 2016.
So as the market price for bitcoin grew and mining pools expanded, so too did the demand for better cards – That’s when FPGA and ASIC mining cards entered to increase computing power.
Since then, ASIC has dominated even FPGA and it is so much more efficient at mining and became the new standard.
This however did cause a few problems with Bitcoin’s decentralization. As the cost to run a profitable mining operation grew more and ASIC cards were heavy on the wallet, this meant a smaller group of people were ‘eligible’ to mine bitcoin. You need to be quite wealthy to compete with the largest miners of bitcoin. And because of this… the problem leads to a few small centralized groups of people responsible for the entirety of Bitcoin’s network.
Bitcoin Mining’s Electrical Consumption
As of 2021, the Global Bitcoin’s entire electrical consumption is 77 TWh per year… making it more expensive to run than entire countries like Switzerland (56 TWh).
The major areas where miners operate out of are China, Europe, USA and Canada.
In China, electricity prices can be as low as 2.5c per kWh.
As Bitcoin’s hash rate and difficulties increases, the energy consumption will also increase. Some analysts fear Bitcoin could use up more energy than Canada in the future.
This is why the cryptocurrency market has shifted away from Proof of Work to Proof of Stake with coins like EOS, ADA, ETH 2.0 and DOT to combat increasingly expensive energy consumptions.